
Today it’s essential to communicate information to the right audience both quickly and effectively. Time means money, and in a world that’s operating ever-increasingly online, presentation is everything.
Infographics are becoming essential tools for communicating complex swathes of information online. At their best, this form of data presentation can be eye-catching, impactful, and highly informative due to the volume of information it’s possible to add to the graphic.
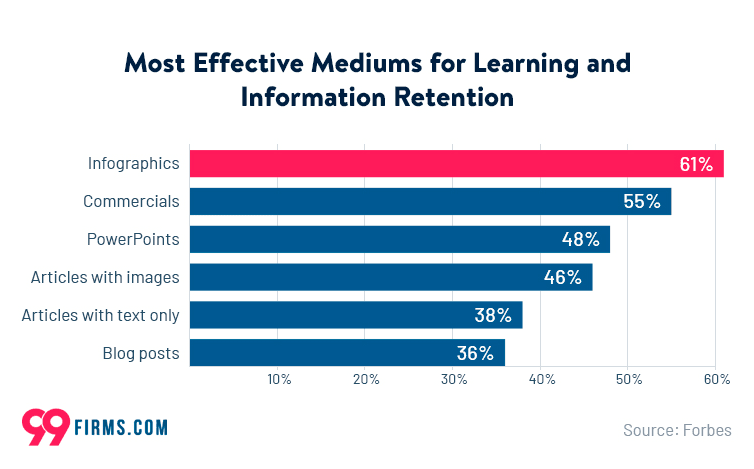
As we can see from the data above, infographics can be a more powerful tool for learning than traditional presentations, articles featuring images, and even commercials.
Despite their effectiveness, many users still struggle with the notion of creating their own infographic. This is usually down to difficulties in the production process of an engaging and easy-to-follow graphic. However, it’s possible for users to build impactful infographics in just a matter of minutes when taking a moment to plan out their content and use the right tools.
So, how can you create a winning infographic without spending excessive time and effort on your creation? Let’s take a look at some key considerations to keep in mind:
The Art of Communication
One of the first things to keep in mind is that the essence of infographics is more about communication than it is design. It’s important to avoid getting bogged down in choosing specific fonts, colour schemes, and supporting images when it’s drawing too much attention away from your content.
Your infographic design should offer an extra dimension to your information. It can help to set a tone, or level of expectation to your content in a way that raw information can’t, and in a way that’s tidier than using text.
Know Your Audience
It’s also essential to understand exactly who you’re showing your infographic to. As lead designer of your graphic, it can be easy to forget that you’re not actually pitching your information to yourself.
One key part of making a great infographic revolves around understanding who you’re creating it for. Who your target audience is will heavily influence the data you choose to include, the tone of voice, and level of imagery you decide to include.
As part of this process, it can be handy to ask yourself a few questions, like whether your audience is internal or external. For an internal audience, you may not need to include entry-level information because you can make a safe assumption that they’ll have a similar knowledge level to you.
You’ll also need to take some time to consider the position, and level of knowledge that your target audience will have. There’s no point in including complex information into your presentation if it’s for interns who haven’t yet developed a simple understanding of the subject matter. Likewise, if your infographic is for an audience with a high expected knowledge level, you could risk causing them to switch off by using too much space talking about the basics.
Compile the Right Data
The next important step to take is to compile the data you plan to use in your infographic. For this, you can either use third party data or sort through your own metrics. Remember, if you use data from a third party source, be sure to cite your sources for ease of reference later on.
Here, it’s essential that the data you use is comprehensive enough to provide readers with the right level of context surrounding the data you’re presenting. Isolated areas of data can be misleading, so be sure to avoid presenting anything that isn’t backed up by more information.
For instance, if you’re highlighting a strong month for sales for your business, include the surrounding months of sales performance. Even if they aren’t remarkable alone, they help to illustrate the strong performance of the month that you’re highlighting.
Finding the Right Time-saving Tools
One of the best ways to save time in creating your infographic is to find a pre-designed template that’s ideal for you to add your information to.
There are many platforms that offer both free and paid infographic templates, and one of the largest collections available for users can be found at Powered Template. With over 1,200 infographic designs – with around one-third available for free usage with just an attribution required.
With a strong series of pre-designed and 100% editable infographic templates that are compatible with a range of software, the design process of creating an appealing infographic can be delegated to skilled content creators, with you simply having to add the information later on.
Once you’ve created your infographic and added all the relevant information without running the risk of cluttering your design, you can share your content with the world. It could be a good idea to send your infographic to one or two peers to ensure that the information is easy to follow for their eyes just as it is for yours.
Remember, communication takes precedence over aesthetics, and if something isn’t quite right, it’s important to reassess your layouts. Infographics are enjoyable, engaging, and informative at their best. As long as you can keep your audience educated and entertained, your infographic will be a success.
